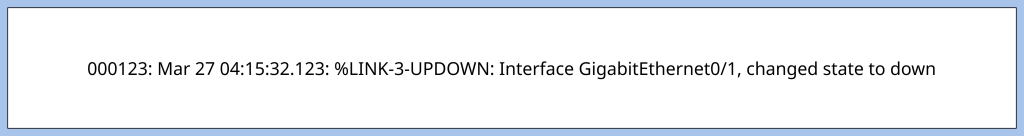
Today I am going to talk about syslog. Syslog is a UDP (port 514) protocol that is the standard for logging where it allows network devices to generate, store and send event based notifications to a centralized server. If you have been doing any type of labs, you have definitely seen a syslog message as they appear automatically in the CLI of cisco messages. Syslogs come in a specific format and are useful for monitoring device and network health like when a router fails, or an interface fails. It is good for troubleshooting system or network issues like if an interface failing caused a routing outage. Syslogs are also great for security auditing and event tracking so whenever a user has SSH’d or failed to SSH into the router or network device, a syslog message shows details as to when that event occurred. Below is the format of a syslog message, and I will be breaking down each part of the notification.
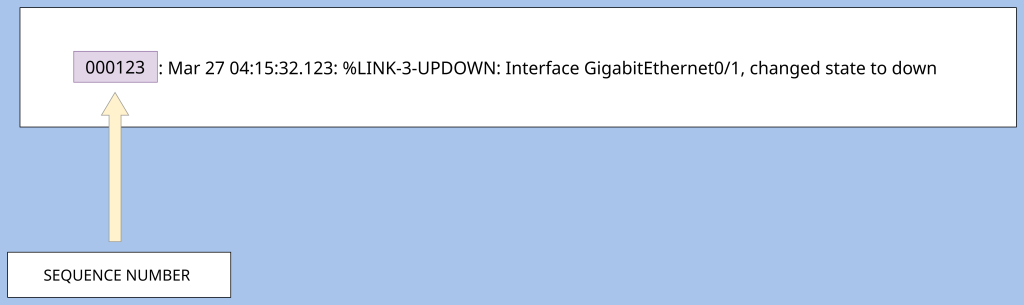
Sequence Numbers- The first part of a syslog message is an optional field called “sequence numbers.” These are unique, incrementing numerical numbers that are used to identify each syslog message generated by a network device. These help to detect missing logs, duplicate logs or out of order logs. These sequence numbers will make it easier to detect all of those because one log should not have the same sequence number as another log.
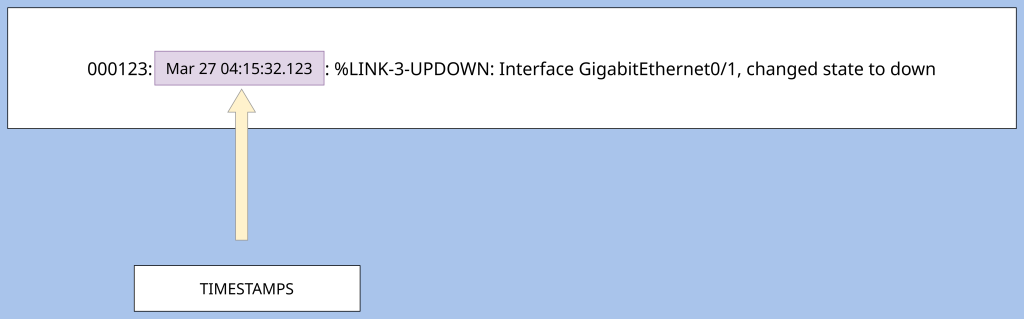
Timestamps- The next field is called timestamps which is a field in a syslog message that records the exact date and time an event occurred on the device. This also makes the network administrators job easier and helps them to troubleshoot network problems effectively. Timestamps are great for event correlation, allowing network administrators to correlate how one event on a device relates to other events that happened on other devices. An example of this would be an interface causing a router outage. A syslog would be generated with a timestamp stating when the interface failed or shut down, followed by another syslog message and timestamp of the routing protocol neighbor adjacency failing and the route being withdrawn from the routing table. These syslog messages which can happen on multiple devices can be aggregated and compared to prove that the interface that had failed caused the routing outage, making it much easier to troubleshoot. If there had been no timestamp, the hypothesis that the interface causing the routing outage would not be provable because it could have been earlier in the day or perhaps after the routing issues.
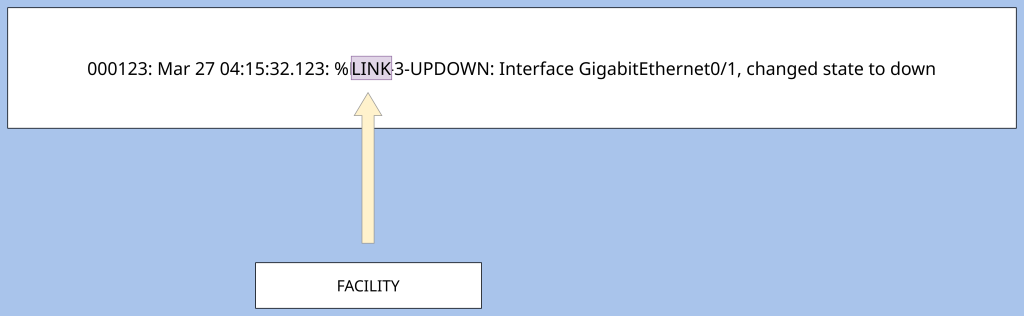
Facility- The next part of the syslog message is the facility. The facility is the field of the syslog message after the timestamp, that indicates the source or type of system component that generated the message. Common types of system components where a syslog message can originate from are a kernel (syslog from OS kernel) , mail system, syslog internal system, or users (logs from use-level applications and processes)
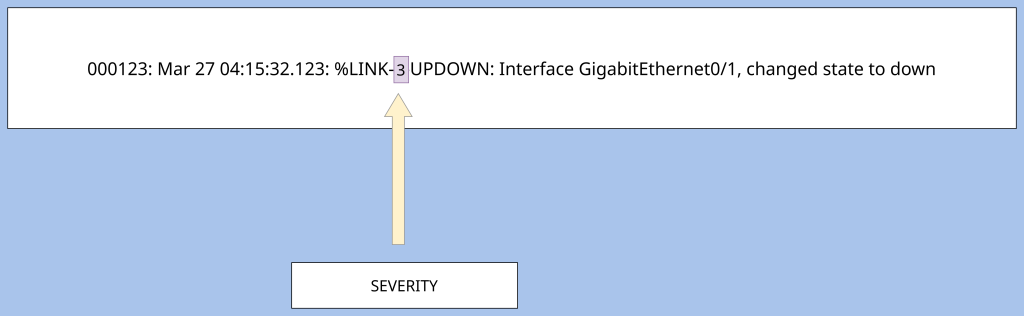
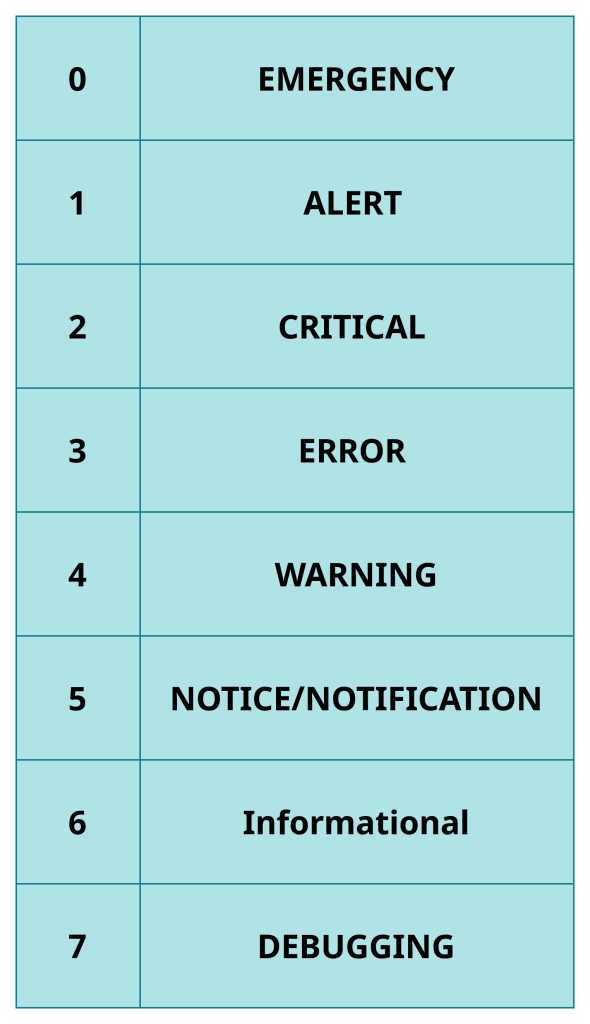
Severity- The next field in a syslog message is “Severity.” Severity is the part of the syslog message that provides a numerical value ranging from 0 to 7 that indicates the urgency or importance of a message. It can range from a message being an emergency which is level 0 to something mediocre like a notification (level 5), to something that is not urgent at all like level 7 (debugging.) An example would be administratively turning off or turning on an interface, this is a level 5 (on cisco) which is just a notification or notice level of importance.
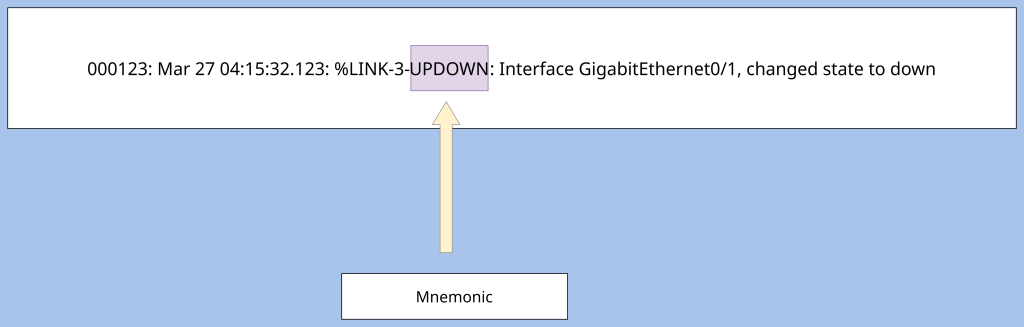
Mnemonic- The field that comes after severity is “Mnemonic.” Mnemonic is a field of the syslog message that is a short uppercase, text-string code that identifies the type of event that occurred on the device. These will be seen as something like LINK_DOWN or UPDOWN. LINKDOWN means that the “event” is the link shutting down. UPDOWN is the “event” that the interface has changed its state. CONFIG_I indicates that the configuration was changed. As you can see these messages are purely uppercase (I am only talking about Cisco for the sake of CCNA).
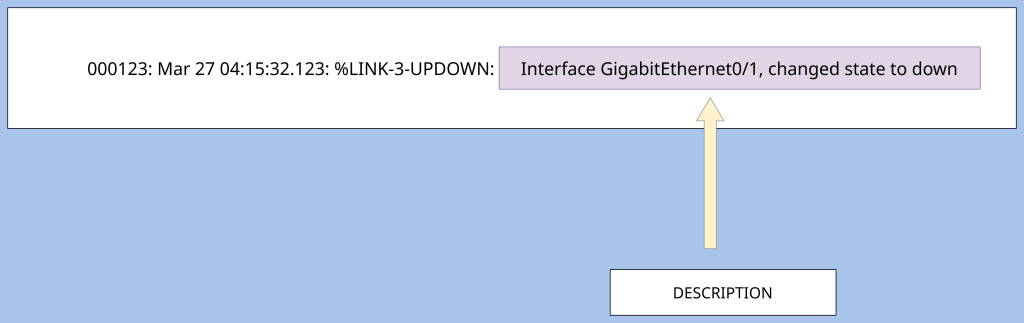
Description– The last part of the syslog message is the “description.” The description is usually at the end of the syslog message that provides a detailed explanation of the event that occurred on the device. It provides a human readable explanation so the reader can gain more context as to what happened. The type of description message you would receive is “link g0/1 changed state to down.” From that description you know the the exact link #(g0/1) and what exactly happened (the link changed to a down state.)
Leave a Reply